Blue Prism component monitoring
Blue Prism component monitoring
Blue Prism infrastructures will comprise a number of different components each of which can be monitored and polled to verify that it is available and responsive. When monitoring the Blue Prism components, standard third-party tools and techniques can be used to evaluate the following:
- Health of allocated hardware (e.g. disk space, CPU utilisation, network connectivity).
- Availability of specific windows services (e.g. service started, responding on the appropriate port).
- Windows Event Viewer – should be actively reviewed for any errors raised on all devices which are part of a Blue Prism environment.
Additionally, Blue Prism provides a number of features and techniques that can be used to assist with monitoring process execution and any associated errors.
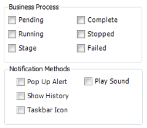
Process and Schedule Alerts can notify administrators or controllers, directly on their own desktop, using a range of indicators including:
- Pop-ups
- Sounds
- Taskbar icons
Additionally custom notification types can be implemented such as sending an email or raising an SNMP trap.


No comments